 Inventory Reports: Usage Inventory Reports: Usage
 Usage Reports show what Inventory and Prep Recipes were used and should have been used over a certain time period. The Reports will show the difference or variance between those two numbers. Fixing the variances delivers dollars that flow directly to your bottom line. CostGuard’s Usage Reports shows you where the problem areas are, so you can investigate them and fix the issues.
Actual Reports also show your costs of running your operation over time. You can use this report to explain your Income Statement.
Use Usage Reports to watch for such problems as theft, incorrect portioning sizes, or incorrect recipe amounts. The Usage Variance Report details areas that you need to investigate.
Any Inventory Items highlighted on the Variance Report are discrepancies. Print out the Report, and then start investigating. You need to double check adherence to recipes, especially quantities used, and serving sizes. You may also want to check spoilage and waste on perishable items. If one of those four areas cannot explain them, you will need to check for theft.
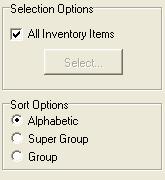
You can choose how you want the information sorted on these reports. For the top half, unchecking the box and click select will allow you to choose specific Inventory items. For the lower box, click one of the buttons to sort alphabetically, by SuperGroup or by Group. This option allows you to customize reports to focus on your high-volume, high-profit, or high-cost items.
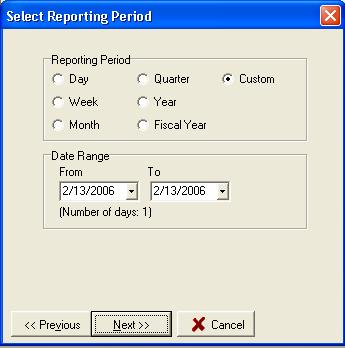
Because Usage Reports are generated for a time period, you need to select
the dates. You can click one of the preset buttons for the reporting
period. The default setting is the Custom button, which will activate
the bottom Date Range fields. Click the  button,
and the calendar will appear. Highlight the date desired and hit
the enter button to accept. Just make sure that your ending date
is after your beginning date. Click Next to continue to the Report.
button,
and the calendar will appear. Highlight the date desired and hit
the enter button to accept. Just make sure that your ending date
is after your beginning date. Click Next to continue to the Report.
CostGuard uses the chosen dates as brackets to calculate usage. CostGuard will search forward starting with the day before your “from” date and backwards from your “to” date. It uses Counts and Transactions that you created during that time to generate the reports.
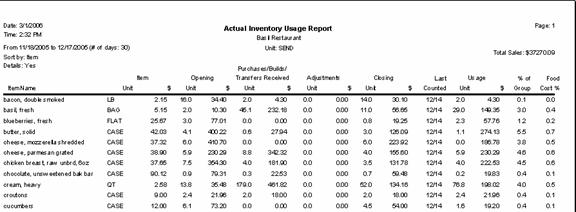
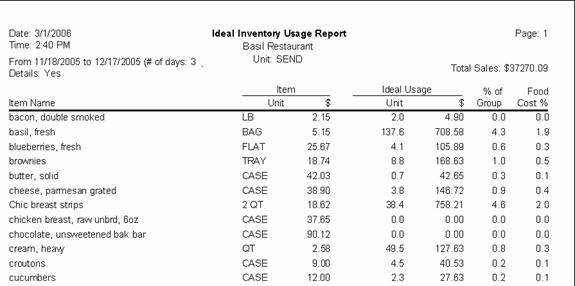
Actual Usage
This Report details each Inventory Item and Prep
Recipe. The simple formula is:
Opening Inventory + Purchases – Closing Inventory = Actual Usage.
It starts with the day before your “from” date (that is, the previous
period’s closing count). When CostGuard finds a count, it automatically
becomes the opening count. Then it adds purchases, transfers received,
positive adjustments, and prep builds. It then subtracts negative
adjustments and the count closest to your “to” date. The last two
columns detail the Food Cost Percentage for the Group and Overall for
this item. You can select and sort for specific Inventory items.
Use this report to determine how much product went through your establishment;
it is the actual cost of running your operation for the period of time
you specify. The final number or usage, should match the ideal usage
shown in the next report.
What if the numbers do not look right? Then check the following:
1. Printout the corresponding Journals: the Actual Inventory Journal and the Inventory Directory. Check the incoming transfers, adjustments, and receipts. Double check the Journal report against original documentation such as invoices to make sure you entered them. If you are missing a transaction, you can enter it with the correct date; just make sure that you date your usage report one day later.
2. Check the Actual Inventory Journal to confirm that there are two counts (opening and closing) during the reporting period. Remember to pick the day before your last count as the “from” date, since that what the Usage Report does. The Usage calculation MUST find two counts, otherwise usage can’t be calculated.
3. If you are comparing reports with different sort criteria, for example alphabetical against group totals, then the information may not match exactly. Check to see that all inventory items have group, vendor, and location information to make the totals match.
4. If the purchase totals don’t look right, that may be because only purchases that occur within the period between the opening and closing counts are included. This report may therefore not show you all your purchases in the reporting period specified.
5. If a count is wrong, you can change or delete the count (link). If other transactions are wrong, there are ways to offset the errors with correcting transactions. Please see explanations with the specific transactions.
After making any corrections, you can simply reprint a report to see the updated results.
Ideal Usage
Ideal Usage Reports show your outgoing Inventory Transactions. It calculates all depletions from Inventory including Sales, Requisitions, Outgoing Transfers, and the individual components of a Build Recipe. For further details on this report, use the Ideal Inventory Journal report. Use this report to check recipe quantities and serving sizes. You can also use it to justify or reconcile physical counts of Inventory Items. The final two columns % of Group and Food Cost % compare that items food cost percentage to the overall actual Food Cost Percentage.
What if the numbers do not look right? Then check the following:
1. Printout the corresponding Journals: the Ideal Inventory Journal and the Inventory Directory. Double check the Journal report against original documentation to make sure you enter them. If you are missing a transaction, you can enter it with the correct date; just make sure that you date your usage report one day later.
2. If you are comparing reports with different sort criteria, for example alphabetical against group totals, then the information may not match exactly. Check to see that all inventory items have group, vendor, and location information to make the totals match.
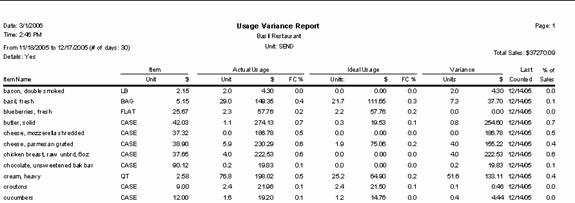
Usage Variance Report
This Report shows the discrepancies between Actual Usage and Ideal Usage. This report shows your problem Inventory Items which you need to investigate. It picks up the numbers from the first two reports, and generates the difference or variance. You can run this report at any time: you do not need to run the Actual and Ideal first for it to generate. You can find a similar report in the Alert Report Section.
Looking at the chart below, the sample restaurant had actual usage of two cases of bacon. The Ideal usage was zero cases. Thus, you need to investigate and resolve the discrepancy. Another major variance is with the heavy cream: you used an extra 52 quarts. This may be an example of possible spoilage, or lack of rotation in the coolers. A negative variance means something should have been used, but was not. You can use this report to find problems with recipes, methods, serving sizes, and portioning methods. You can also use this report to check that your employees are using the correct specified ingredients, such as not substituting a substituting a 6 oz chicken breast for a 4 oz breast.
While the examples below may be exaggerated, they show how you can use this report. Remember that variances are differences from Ideal, and the more that you can find and rectify, the more money is in your pocket.
Click here to return to the Inventory Report overview.
Click here to go to the next section of Inventory Reports, Journal.
Click here to return to the first report screen.